|
<< Click to Display Table of Contents >> Transportation Analysis Principles of Operation |
  
|
|
<< Click to Display Table of Contents >> Transportation Analysis Principles of Operation |
  
|
The Transportation Analysis requires a design surface for the reshaped topography. This can be a surface is generated using 3d-Digs surface reshaping functionality or a surface produced by some other means.
The design surface will typically be produced in 3d-Dig using the Surface Reshaping functionality and when the reshaping task is complete the current topography will be in the reshaped state. This surface is saved externally to the 3d-Dig file as a.bit file for use in the Transportation Analysis. The original 3d-Dig file (with the topography in the post mining state) is then loaded and the reshaped surface bit file is also loaded as an Inner Surface. At this stage the Transportation Analysis can proceed.
The Transport Analysis commences by producing a Difference Surface. The Difference Surface uses the post mining topography and the design surface and for each grid point produces a cut or fill volume. The total cut and fill volume must balance or be close to balancing. The system then performs an analysis which splits up the volumes at each point and determines a near optimal solution to the problem of transporting material from cut to fill subject to the constraint of minimum "cost". The cost is determined using a cost function which establishes a cost for each increment of material moved as a function of distance moved. The cost function can be set up to either reflect the estimated real costs of movement or to act as a penalty for excessive transport distances. The latter is generally the preferred method as it will produce a set of minimum distance transport arcs. The system also allows for the export of data from the completed Transport Analysis. This data is exported to an Excel spreadsheet and consists of a set of distance ranges (bins) with a volume associated with each. Using this spreadsheet data costs can be established using mine specific cost information.
When very large areas are to be subject to a Transport Analysis, compute times can be significant. In such case it is generally best to subdivide the area into a series of contiguous regions each of which is subject to its own local Transport Analysis. The final topic in this series, Subdividing a Transport Analysis, explains how to perform the sub division process.
To run the Transportation Analysis to Simulation Pulldown must be in Reshaping mode:

Simulation Pulldown – Reshape Mode.
The Transportation Analysis dialog is produced using the Main Menu Reshaping/Transportation Analysis:
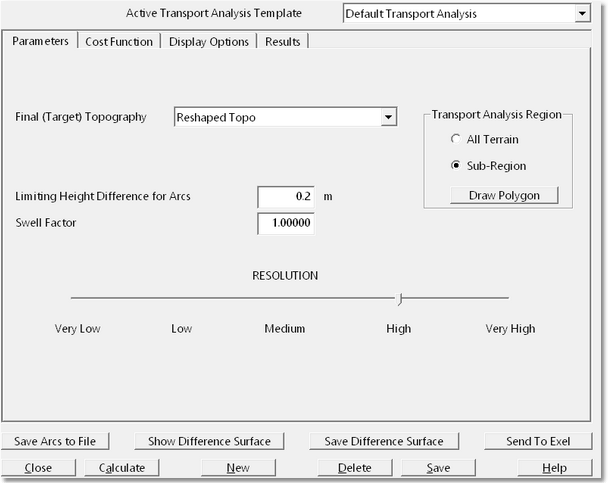
Transportation Analysis Dialog - Parameters Page.
The first page of the Transportation Analysis dialog is the Parameters page. The parameters page contains the following items:
Final (Target) Topography pulldown list. The Transportation Analysis uses a starting topography, this is always the Terrain Surface, and a final or target topography. The Final Topography pulldown list contains a list of all Inner Surfaces and the reshaped design surface is selected as the Final Topography.
Limiting Height Difference field. The Transportation Analysis looks at elevation differences between the Terrain Surface and the Final Topography for all grid points, and creates a gridded surface which models distribution of cut and fill over the design area. The Limiting Height Difference parameter is a threshold value such that the difference in elevation between Terrain Surface and the Final Surface must exceed this threshold in order for a volume to be recorded for that grid point. With some design surfaces very small and insignificant differences in elevation may occur between the design and the Terrain Surface. This parameter allows such small differences to be eliminated from the analysis.
Swell Factor field. Surface Reshaping is typically conducted with an assumption of zero overall swell. All Surface Reshaping conducted with 3d-Dig is Surface Reshaping function will be based on this assumption. However the Transportation Analysis can sometimes be useful in earthworks operations where prime material is moved to fill and swell occurs. Cross pit doze pushing is an example of this. The Swell Factor field is typically set to 1.0 for reshaping tasks and set to the appropriate swell factor when more conventional spoil transport processes are modelled.
Transport Analysis Region group. This group contains two radio buttons All Terrain and Sub–Region. When the All Terrain option is selected the Transportation Analysis will process every grid point within the bounds of the Final Topography. When the Final Topography has been generated by 3d-Dig is Surface Reshaping functionality it is likely to include a significant zone around its perimeter which is common with the Terrain Surface (i.e. terrain which has not been subject to reshaping). When the Sub – Region radio button is selected the user clicks on the Draw Polygon button and the Terrain Cursor becomes active in the Terrain Window. This allows a Polygon to be drawn which will clip the area over which the Transportation Analysis is performed. This option is typically used and a region is drawn which is just beyond the limits of the Polygon is used for reshaping. Clipping the Transportation Analysis region in this manner will typically speed up computation substantially. When a large areas of reshaped topography are to be subject to a Transport Analysis is often best to divide the area into a series of contiguous regions. These regions must have close to balancing earthworks. The topic, Subdividing a Transport Analysis, at the end of this section describes the process of subdividing a large design area into several Transport Analysis regions.
Resolution slider bar. This is the same Resolution slide above which is used in many 3d-Dig functions. It thins the grid model with which the Transportation Analysis is performed. If this slider is set to Very Hi every grid point on the Final Surface will be used for the transportation analysis, if it is set to Very High every second grid point will be used etc. If the Transportation Analysis covers a very large area lower resolutions will typically be required to produce acceptable runtimes. Note that when the resolution is reduced total volumes are unchanged but local volumes are attributed to a larger spaced grid area. Hence the Resolution setting affects the geometry of spoil transport not the volumetrics.
Transportation Analysis Dialog – Cost Function page.
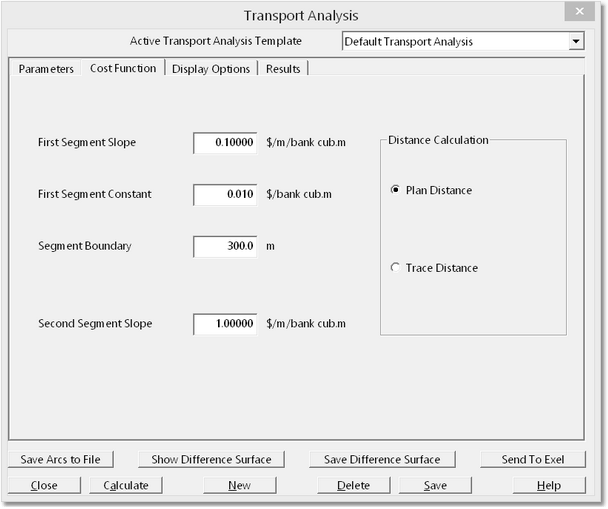
Transportation Analysis Dialog - Cost Function Page.
The Transportation Analysis models the movement of material from cut to fill. For each increment of material transported it establishes a source location and destination. It must also establish the transportation cost and this is achieved via the Cost Function. The Cost Function uses a fixed cost plus a distance related cost (cost per cubic metre per metre transported). The distance related cost has two components:
•Cost from zero distance up to a distance nominated by the Segment Boundary parameter.
•Cost from Segment Boundary onwards.
The first cost component also includes a fixed cost known as the First Segment Constant. The following figure charts the cost function and illustrates these parameters and concepts:
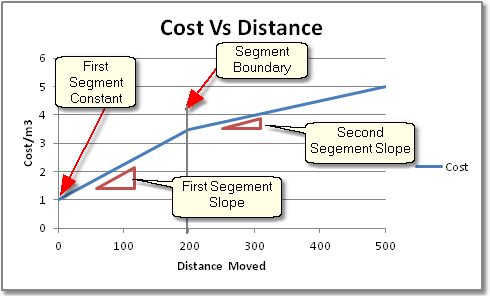
Transport Cost Function.
The cost for each increment of spoil transported is determined by establishing the distance moved and using the above function to determine the cost per cubic metre at this distance. This cost is multiplied by the increment volume to give the total cost.
As well is the above parameters the Cost Function also includes the Distance Calculation group. This group has two radio buttons Plan Distance and Trace Distance. The Plane Distance is the default and with this option the distance used for the cost is a horizontal distance determined using the Easting and Northings of the source and destination points. When the Trace Distance option is selected the total distance over the original topography is used for the cost. However as this surface changes during the reshaping process generally the Plan Distance with suitable cost parameters will give the best result.

Key Information - Cost Function.
The cost function is used primarily to establish the minimum transport distance solution. Although it does produce a dollar value cost, in normal practice it is the spreadsheet containing the bin/volume information which is used to establish the likely cost of implementing the proposed reshaping operation. Hence the cost function is often established with a view to producing the minimum distance solution rather than realistic costs. The cost function is also useful if there is a discreet parcel of material which will be transported over a longer distance by truck or scraper fleet. A properly set up cost function will neatly isolate this material.
Transportation Analysis Dialog – Display Options page:
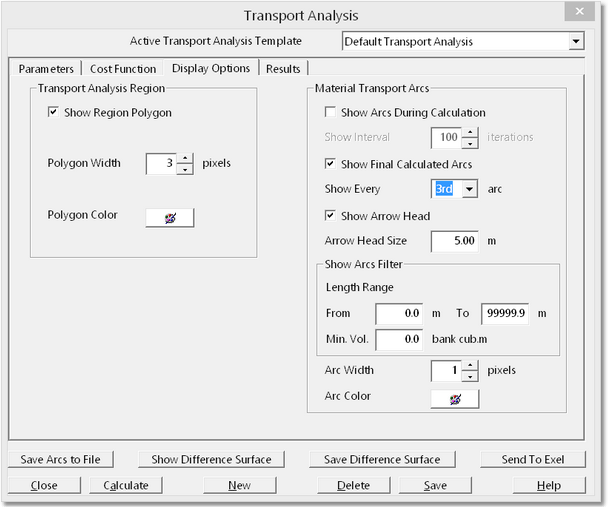
Transportation Analysis Dialog - Display Options Page.
The Display Options page controls how various Transportation Analysis specific objects are displayed in the Terrain Window. It includes the following components:
Transport Analysis Region group. When the Transportation Analysis is applied to Sub Region the user draws Region Polygon to delineate the area within which the analysis will be performed. The items in this group control how, and if, this polygon is displayed.Material Transport Arcs group. The Material Transport Arcs are arrows which graphically display the movement of material from cut to fill. It includes the following components:
Show Arcs during Calculation checkbox and Show Interval field. When this checkbox is selected the Transportation Arcs will be displayed an updated during the calculation process. Various sub optimal arcs will be displayed as the calculation proceeds. This option can substantially increase the compute time and it is generally not recommended.
Show Final Calculated Arcs checkbox and field. When the Show Final Calculated Arcs checkbox is selected the Transportation Arcs are displayed in the Terrain Window on completion of the calculation. The Show Every field allows these arcs to be thinned to make the displayed more legible.
Show Arcs Filter group. This group allows the displayed arcs to be filtered by distance and volume moved. By default all Transportation Arcs are displayed. It is often the case that some Arcs have a very small volume associated with them and their display can distort the overall impression of the required spoil movement. Setting a reasonable minimum volume threshold will eliminate arcs with very small volume. Using the Length Range fields arcs can be filtered according to distance moved. This can be very useful in visualising those areas which require spoil transport over larger or lesser distances.
Transportation Analysis Dialog – Results Page.
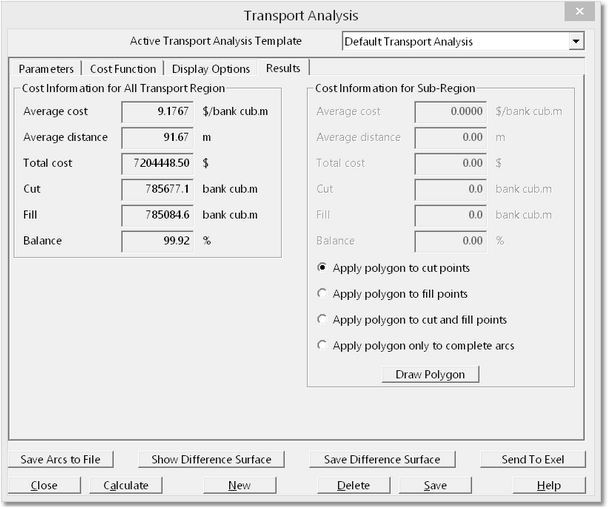
Transportation Analysis Dialog - Results Page.
The Results page contains various tools and fields which quantify the results of a Transportation Analysis. It contains the following items:
Cost Information for all Region group. This group consists of a number of fields that quantify the costs, volumes and transportation distance for the complete design area.
Cost Information for Sub – Region group. This group contains summary information but for a user nominated Sub Region. If the Draw Polygon button is selected the terrain cursor becomes active in the Terrain Window allowing the user to draw a region. The summary information will apply to this region. Using the Transport Arcs as a guide, it is generally possible to place a region within which cut and fill is close to balancing. However as a polygon may not necessarily contain balancing volumes there are a series of radio buttons which allow the user to select how the system treats data points within the nominated region boundary.
Transportation Analysis Dialog – Function Buttons.
Along the bottom of the Transportation Analysis dialog are a number of function buttons:

Transportation Analysis Dialog – Function Buttons.
The buttons perform the following functions:
Save Arcs to File. Clicking this button will bring up a filer box allowing the transportation arcs to be saved as a DXF file. This allows the arcs to be loaded into other CAD packages.
Show Difference Surface. The Difference Surface is the grid model which maps areas of cut and fill. Clicking this button will produce a window displaying the current Difference Surface.
Send to Excel. This button allows the Transportation Analysis results to be saved to an Excel file. When the button is selected dialog box appears which allows the user to nominate a Distance Step parameter:
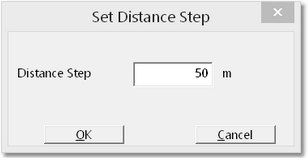
Distance Step Dialog.
Data is exported to a spreadsheet which lists volumes filtered by distance moved using the Distance Step parameter:
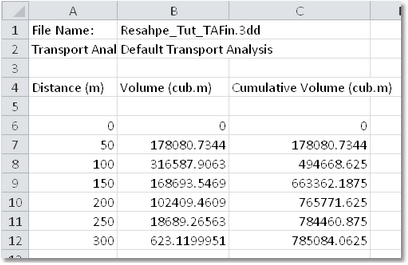
Transport Distance Summary – Excel Export.
Note that by using the Show Arcs Filter on the Display Options page the group of arcs associated with any of these distance ranges can be displayed.
Calculate. When the Transportation Analysis is initially set up clicking the Calculate button initiates the calculation process. Once this process commences a progress box appears on the screen:
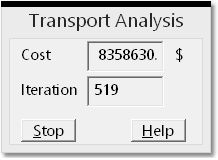
Transportation Analysis Progress Box.
This progress box shows the number of iterations currently completed and the current cost. With experience it will be possible to establish, given the rate at which the used iteration count progresses, how long the analysis is likely to take to complete. If the iteration count is increasing by of the order of one per second and the area being modelled is large then the calculation is likely to take hours to complete. In such cases the Stop button can be used to terminate the analysis and the Resolution setting modified and the process restarted.
New button. Clicking the New button will allow a new Transportation Analysis to be created and named. Frequently only one Transportation Analysis is required in a file however more than one can be required under the following circumstances:
•The same area is to be modelled with different cost functions.
•Several independent areas have been reshaped and need to be analysed within the one file.
Delete button. Clicking the Delete button will delete the current Transportation Analysis and all associated information.
Save button. Clicking the Save button will save the current Transportation Analysis. If the Save button is clicked after the full Transportation Analysis has completed, and the 3d-Dig file is subsequently saved, then all of the Transportation Analysis information will be saved to file.