|
<< Click to Display Table of Contents >> Setting up a Dozer Simulation |
  
|
|
<< Click to Display Table of Contents >> Setting up a Dozer Simulation |
  
|
The process of setting up a Dozer Simulation is described with the aid of an example operation. This operation involves a cross pit waste pushing in a strip mining operation. The strip layout is shown in the figures below:
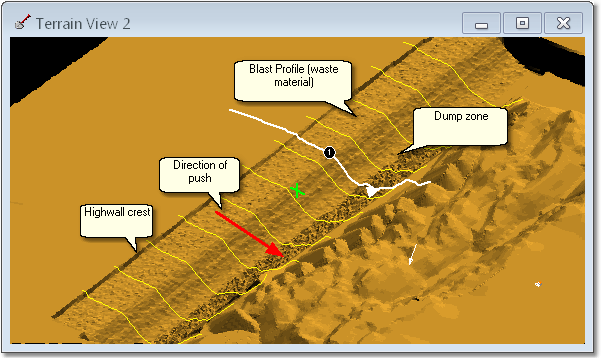
Dozer Simulation Example Operation.
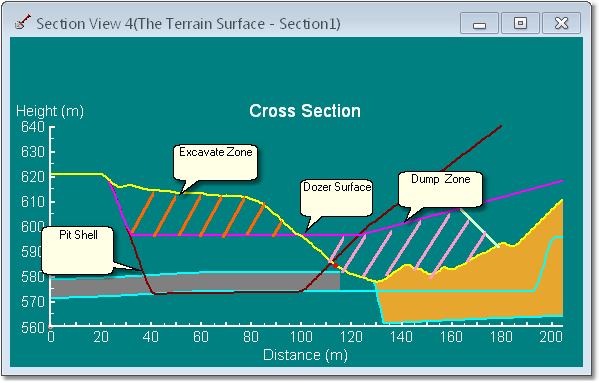
Dozer Simulation Example Operation - Cross Section View.
Of this operation has the following characteristics:
•Push direction is consistently cross – pit (normal to pit axis).
•Excavation and dumping are both limited by the Dozer Surface.
•The Dozer Surface in the area of the dump zone is such that it contains an excess of spoil room. Consequently there is sufficient and excess spoil room for the entire length of the operation.
The first step in setting up a dozer simulation is to select the Dozer mode from the Simulation Pulldown List:
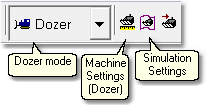
Dozer Simulation Group
With the Dozer mode selected clicking the Machine Settings (Dozer) dialog will open:
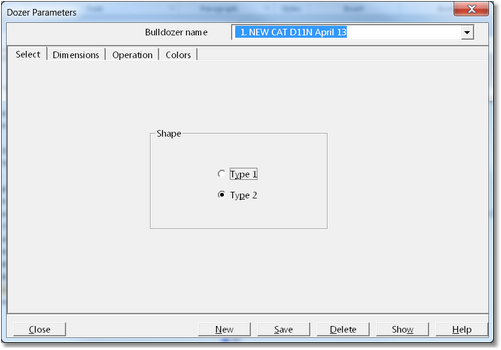
Dozer Parameters dialog, Shape page.
The bulldozer model has been loaded from file it will appear in the Bulldozer name pulldown list at the top right of the dialog. If no Bulldozer is present click the New button on the bottom row of the dialog to create a new Bulldozer.
The first page of the Dozer Parameters dialog is the Shape page. The Shape page has two settings: Type 1 and Type 2. These control the appearance of the dozer, type 1 is low track and type 2 high track. This setting has no affect on the operation of the model.
The Dimensions page has parameters defining the machine dimensions:
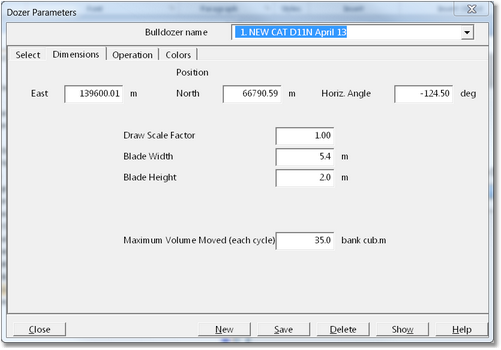
Dozer Parameters Dialog - Dimensions Page.
The Dimensions page contains the following parameters:
•East, North, Horizontal Angle. These parameters set the location and orientation of the dozer model as it appears on the topography prior to simulation. Once simulation commences the simulation model controls the position and orientation of the dozer.
•Draw Scale Factor. This parameter allows the dozer modelled as it appears on the topography to be scaled up above its actual size. This makes the dozer more visible during simulation. This parameter is purely visual and does not affect the simulation.
•Blade Width an Blade Height. These parameters control of the relative size of the blade as it appears on the dozer. These parameters are purely visual and do not affect the simulation.
•Maximum Volume Moved (each cycle). This parameter is the effective bulldozer blade capacity. It influences the productivity calculation in the following manner:
Controls volume moved each cycle.
In conjunction with material density and the Friction Resistance Coefficient (an Operation parameter, see following paragraph), it establishes the force which must be generated by the dozer to push the load. Note that when the Simulation Setting 'Optimise Blade Load' is selected the system will automatically determine the blade load which will produce the optimum cycle considering volume moved per cycle and forward speed. This optimised blade load is limited by an upper bound equal to the Maximum Volume Moved parameter.
The Operation page contains parameters that control the dynamics of the bulldozer during simulation:
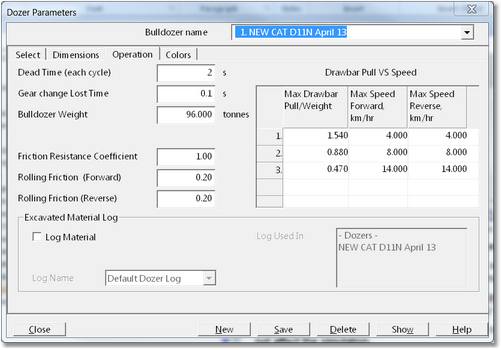
Dozer Parameters Dialog - Operation Page.
The Operation Page contains the following parameters:
•Dead Time (each cycle).For each incremental step of the simulation system determines the travel time taken by the dozer to complete the cycle and the number of cycles required to move the associated volume. The Dead Time is an additional time component that is added on to the dozer travel time to determine the total cycle time. This time can be used to account for fill time, dump time and any other fixed lost time per cycle.
•Gear change Lost Time. This parameter is the time impost associated with a gear change and every time the system detects a gear change throughout the cycle this fixed component is added to the total cycle time. As an example if a cycle has six gear changes then time component equal to the Gear change Lost Time multiplied by six will be added to the cycle time. For many machines a value of zero may be appropriate.
•Bulldozer Weight. This is the net weight of the bulldozer.
•Friction Resistance Coefficient. Using the Blade Load parameter and the material density the weight of the blade load is calculated and from this the force normal the gradient is determined. This is multiplied by the Friction Resistance Coefficient to determine the force required to move the load.
•Rolling Friction (Forward) and Rolling Friction (Reverse). Using the Bulldozer Weight parameter of force normal to the gradient is determined. This force is multiplied by the Rolling Friction factor to determine the force required to move the machine itself forward or reverse.
•Drawbar Pull versus Speed table. This is the machines speed - rimpull curves as described in the previous section.
 Key Information - Reverse Speeds in Simulation
The bulldozer model uses the gradient of the dozer path (this may vary along the path) together with the other operation parameters and the rimpull curve to determine the dozer reverse speed/speeds when reversing. This approach will establish the maximum theoretical reverse speed given the various parameters and gradient. In practice maximum reverse speed is often limited by the material, the quality (flatness) of the path and operator practice. If the dozer path has significant ruts and corrugations it may be uncomfortable or injurious to the operator to reverse at the maximum speed and consequently the speed will typically be limited to some lesser number. When calibrating the dozer model reducing the maximum reverse speeds as they appear in the rimpull curve may be required to more accurately simulate reverse speeds in the field.
The final page of the Dozer Parameters dialog is the Colors page:
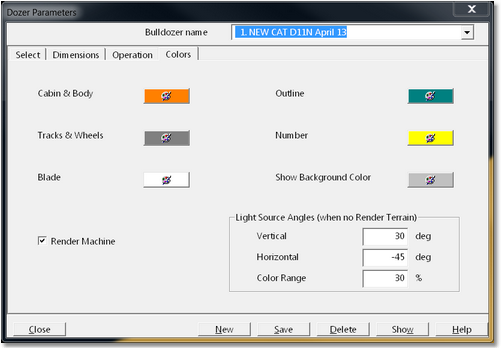
Dozer Parameters Dialog - Colors Page.
This page contains settings which determine the color of the dozer model.
Once a suitable dozer model is established the simulation can be set up. The set up is conducted by clicking on the Simulation Settings button in the Dozer Simulation Group:

Dozer Simulation Group
This will open the Dozer Simulation dialog. Setting up the simulation involves completing the appropriate settings and procedures for each page of this dialog in turn. Once complete the simulation is ready to run.
Bulldozer Simulation Dialog
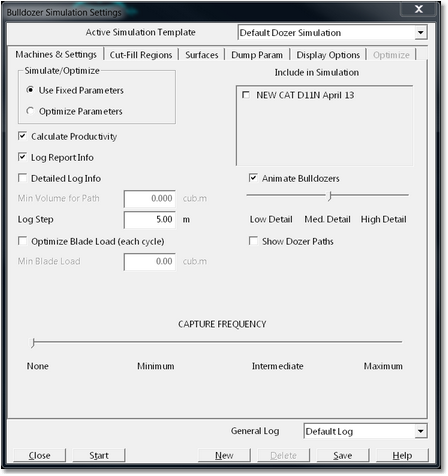
Dozer Simulation Settings Dialog – Machines & Settings page.
This page contains general settings and allows the individual dozer or dozer fleet to be nominated. It contains the following elements:
Simulate/Optimise group. This group consists of two radio buttons; Use Fixed Parameters and Optimise Parameters. Most typically the simulation is done in the Use Fixed Parameters mode. In this mode the simulation is conducted using fix parameters specified by the user. In the Optimise Parameters mode the system systematically varies specified Parameters to seek an optimum. This is a very powerful function however it needs to be used carefully as it can lead to very large compute times if a large job is set to optimise all parameters. This is explained further in the following section.
Dozer Selection Group. This group is titled Include in Simulation. It contains a list of all dozer models present in the file and each has a checkbox. All dozers selected virus a checkbox will be included in the simulation. If two or more dozers are selected cycle times and productivities for each will be determined and the reported productivity will be the sum of the productivities for the selected machines.
Calculate Productivity checkbox. When selected productivity will be calculated for the simulation. This checkbox is checked by default and most typically a simulation is run with the productivity calculation conducted. However there can be situations where only a topographic simulation is required and this will be calculated more rapidly if Calculate Productivity is deselected.
Log Report Info checkbox. When this checkbox is selected a text file is produced which contains a summary of the productivities for each increment of the simulation.
Detailed Log Info group. This group allows a text file to be saved which details dozer cycle information. This information is similar to the raw data produced by a dozer monitoring system. Dozer speeds at various points along the dozer path are recorded. This file consists of a set of eastings, northing, RL and speed data points. It has two options, Minimum Volume for Path and Log Step. All cycles with volumes less than the nominated Minimum Volume will be filtered out and not included in the file. The Log Step is a distance controlling the frequency of data points. These files are useful when calibrating a new dozer model.
Optimise Blade Load group. This group consists of a checkbox and a field for Minimum Blade Load. When Optimise Blade Load is selected the system will will calculate the geometry for the push part of the cycle and determine the optimum blade load. A large blade load will deliver more volume per cycle but will produce lower forward speeds and hence reduced cycle times. A small blade load will deliver less volume per cycle produce faster forward speeds and hence a lower cycle time. The the maximum blade load that the system will use will be limited by the Maximum Volume Moved each Cycle parameter set in the Dozer Parameters dialog. the Minimum Blade Load that will be used is that set in the Min Volume for Path field.
 Key Information – Blade Load and Cycle Feasibility.
When Optimise Blade Load is NOT selected the system must use the volume specified by Maximum Volume Moved parameter. If the cycle includes some uphill pushing the dozer may have insufficient power to push this volume uphill. In such cases the dozer simulation will deem the cycle to be non-feasible. When the simulation is complete a message will be produced indicating that a specified percentage of the volume could not be moved and the productivity is based on the balance of the volume. When Optimise Blade Load IS selected the system has the flexibility to reduce the blade load in order that the dozer can push the material at the uphill gradient.
Animate Bulldozers Group. When the Animate Bulldozers checkbox is selected the bulldozer will appear on the topography moving along the simulation path. A sample of paths are selected for each increment of the simulation and the animation involves placing the dozer at various positions along the path. The number of paths animated and the number of dozer positions shown is controlled by the Detail slider bar. The checkbox Show Dozer Paths allows the individual paths to be shown as a line on the topography during simulation.
Capture Frequency Group. The Capture Frequency Group is a slider bar controlling how frequently images are captured for the animation file. When the Capture Frequency slider is set to the None position no capture is conducted. The various other settings allow animation of varying details to be captured. The higher the setting the more detailed the animation but the larger the resultant file. Note that the Detail setting in the Animate Bulldozers group will also influence the number of images captured and the size of the resultant animation file.
General Log Pulldown List. The General Log Pulldown allows the Material Log set up for dozer simulation to be selected.
 Warning - Material Logs and Dozer Simulation.
The Material Log selected for use in the simulation has a critical effect on the simulation. The the swell factor will affect the way in which the dumps buildup and their ultimate geometry, this in turn affects dozer cycle geometry and productivity. The specified material density will affect the weight of the load carried by the dozer and the forces generated by friction and hence the machine speeds in the push part of the cycle.
Cut Fill Regions Page.
The concept of Cut Fill Regions, or "Regions", is a key concept in bulldozer simulation. The area subject to dozer simulation is divided into a series of Regions.
The Dozer simulation is conducted in a series of incremental steps. These steps progress vertically, as described earlier in this topic, and also progress horizontally. The horizontal steps are created by the use of Regions. The simulation progresses in the following manner:
•The first vertical lift for the first (lowest numbered) Region is simulated.
•The first vertical lift for the second Region is simulated.
•The above process is repeated until the first vertical lift has been completed for all Regions.
•The second of vertical lift for the first Region is simulated, and the above steps are repeated until the second of vertical lift for all Regions is completed.
•The above steps are repeated through all vertical lifts and all regions until the simulation is complete.
The Regions typically extend across the operation from the start of the excavate zone to the limit of the fill zone. The Regions contain an area of balancing cut and fill or an area with an excess of fill. They represent a small subset of the operation and they are typically approximately rectangular in shape with a high aspect ratio and with the long side oriented in the direction of push.
The following figure shows a typical set of Regions for the example operation described at the beginning of this topic:
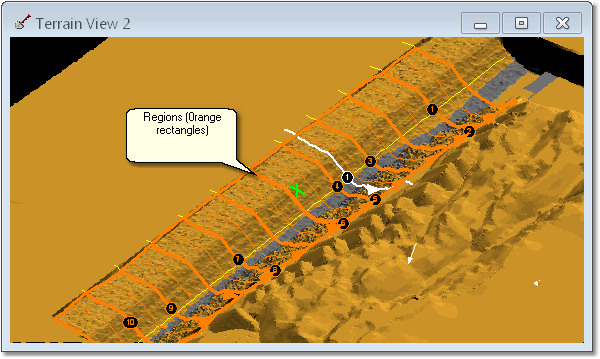
Complete set of Dozer Regions for Simulation.
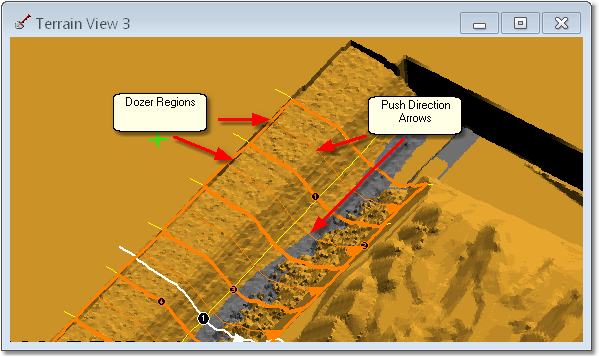
Dozer Regions Detail.
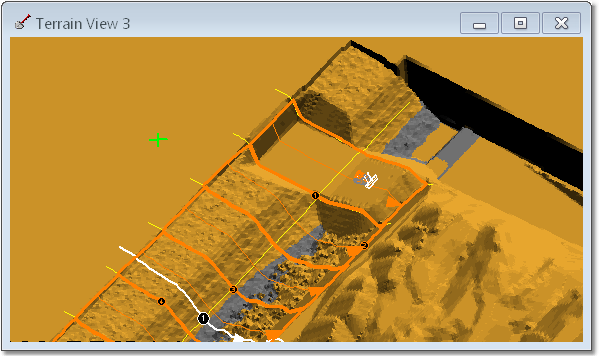
Region 1 Complete (note - all regions are normally simulated in unison).
The set of cut fill Regions must meet the following requirements:
1.The full area to be simulated must be covered by Regions.
2.Each Region must cover a unique area. That is to say there should be no significant overlap between regions. In practice a small amount of overlap at common boundaries between Regions is necessary however Regions should not overlap to a large extent.
3.Volume balance must occur within a region or there must be an excess of spoil room. Failure of a region to have sufficient spoil room to accommodate material excavated within that region will result in some material remaining in the excavation.
4.The regions should have a shape which is "long and narrow" with the long side oriented in the primary direction of push (see figures above).
Setting up the parameters for Regions and creating the Regions is conducted using Cut Fill Regions page:
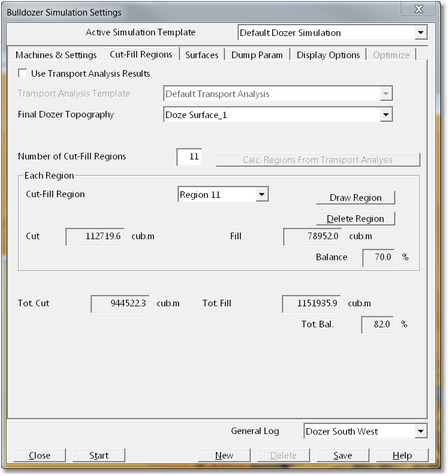
Dozer Simulation Dialog – Cut Fill Regions Page.
The Cut Fill Regions page has the following elements:
Use Transport Analysis checkbox. This system is currently under development and the checkbox should be deselected.
Final Dozer Topography pulldown list. This pulldown list contains all inner surfaces and the dozer simulation design surface should be selected.
Number of Cut Fill Regions field. The number of Regions to be used should be entered into this field.
(Each) Region Group. This group allows each individual region to be created. The process of creating a region involves selecting the Region number from the Cut – Fill Region pulldown list then clicking the Draw Region button. The Terrain Cursor will become active in the Terrain Window allowing the user to point and click to draw the region. When all corners of the region are created right click to complete the region. A Region can be deleted using the Delete Region field. There are three fields (Cut, Fill and Balance) which report the volumetrics for each region as it is created.
Total Volume Fields. These fields (Tot Cut, Tot Fill, Tot Bal) report the total cut, total fill and percent volume balance for the full area of the simulation. Note that in the figure above the Dozer Design Surface has an excess of fill and this is indicated by the numbers in the Total Volume Fields.
 Tip – Editing Dozer Regions
Once dozer regions are created they appear as string elements on the topography in Terrain Windows. You can point to these elements and left click to select and edit them using the standard techniques for editing vector elements. If you find that after placing a Dozer Region it shape is not quite correct, you can corrected at any stage after the process of setting up the Dozer Simulation. Simply point to the region in a Terrain Window left click and released to select and then edit in the usual manner. Vertices can be moved, created and deleted. If you find, after the initial set up, that the number of Dozer Regions is not ideal (more or less regions are required) you can re-enter the Cut Fill Regions page of the Dozer Simulation Settings dialog and modify the number of regions.
Surfaces Page
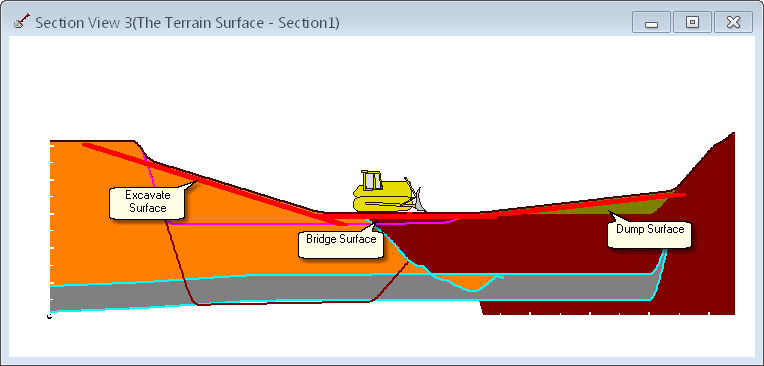
As described previously, simulation proceeds in a series of incremental steps. There are a horizontal increments controlled by the regions described above, and vertical increments. The vertical increments involve excavating and dumping to a series of incremental surfaces generated by the simulation system. There are three types of incremental surfaces; Excavate Surface, Bridge Surface, Dump Surface. These surfaces are illustrated in the following diagram:
Incremental Dozing Surfaces.
The above diagram illustrates the incremental surfaces at a particular state of the simulation. A full simulation involves generating a sequence of these surfaces starting with a surface close to the initial topography and terminating with surfaces close to the design target surface. The number of surfaces used is controlled by the Surface Spacing parameter which sets the vertical interval between vertically adjacent surfaces. In the above diagram all three surface types (Excavate, Bridge and Dump) are utilised. Depending on the type the dozing operation being simulated various combinations of these incremental surfaces may be used.
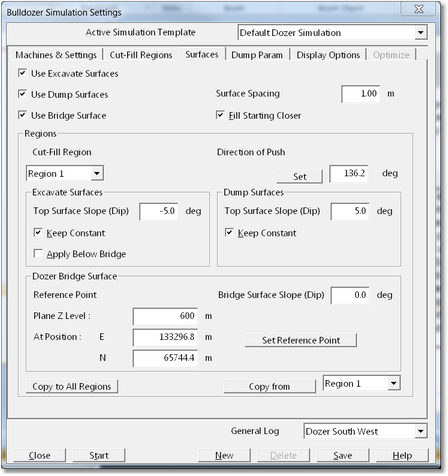
The geometry of these incremental surfaces is controlled by settings implemented on the Surfaces Page:
Dozer Simulation Dialog - Surfaces Page.
The Surfaces page consists of the following elements:
Use Excavate Surfaces checkbox. When this box is checked incremental Excavate Surfaces are generated and used in the simulation.
Use Dump Surfaces checkbox. When this box is checked incremental Dump Surfaces are generated and used in the simulation.
Use Bridge Surface. When this option is selected a Bridge Surface is generated and used in the simulation.
Surface Spacing field. This field allows input of the Surface Spacing parameter. The Surface Spacing parameter controls the vertical distance between adjacent incremental surfaces (Excavate and Dump Surfaces).
Start Filling Closer checkbox. If this box is unchecked excavated material is transported to the most distance part of the dump and deposited. If this box is checked excavated material is dumped using the advancing dump method at the end of the current tip face. The location of the tip face, and the dump constraining surface, are established as follows:
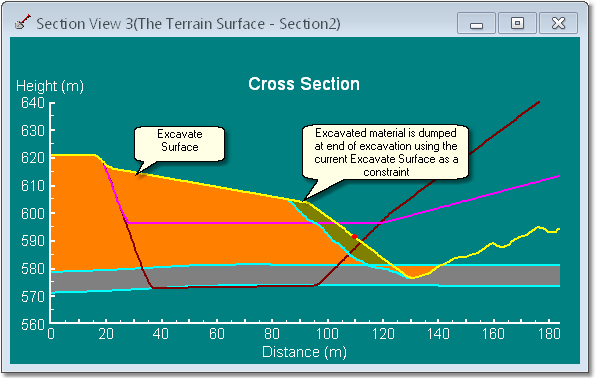
In the early stages of the simulation excavated material is dumped at the end of the excavation zone and dumped using the Excavate surface as a constraining surface:
Initial Dumping Constrained by Excavate Surface.
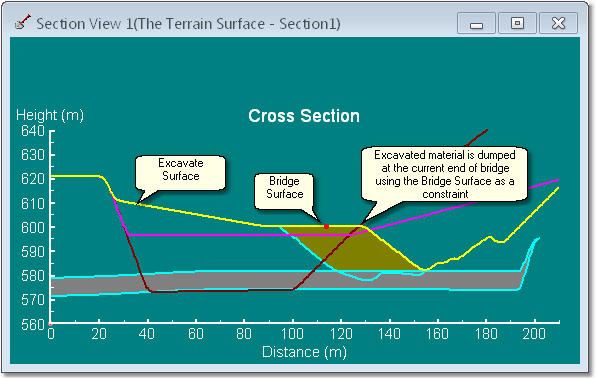
Once dumped material extends to the Bridge Surface material is dumped at the end of the dump zone and dumped using the Bridge Surface as a constraining surface:
Intermediate Dumping Constrained by Bridge Surface.
Once the Bridge is complete material is dumped at the end of the dump zone and dumped using the Dump Surface as a constraining surface:
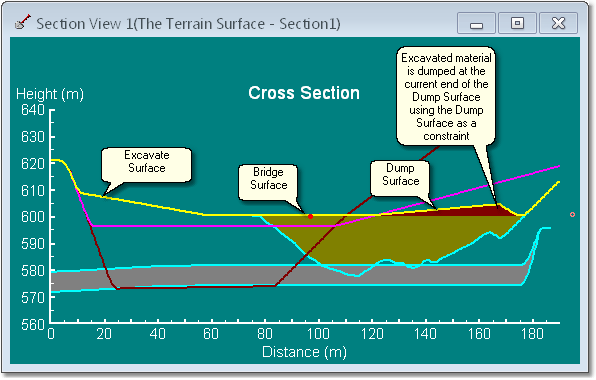
Final Stage Dumping Constrained by Dump Surface.
Surface Spacing Field. The Surface Spacing parameter controls the vertical offset between adjacent Excavate and Dump Surfaces. The smaller this parameter the more surfaces will be generated and the smaller the vertical distance between them.
 Key Information - Surface Spacing and Productivity Calculation
The Surface Spacing parameter can critically affect the productivity calculation in a number of ways.
As simulation progresses the relative level of adjacent regions frequently differs resulting in a step between adjacent regions. Excavated material can rill out at repose angle and hence be transferred between regions. This effect occurs in practice and is not unrealistic, however it can become excessive if the selected Surface Spacing is too large.
Some of the material which is dumped during the excavation of a particular Excavate Surface is usually re-excavated and rehandled during the excavation of the subsequent Excavate Surface. In this manner the system establishes the Rehandle volume. If the Surface Spacing is excessive this can adversely affect rehandle calculation.
Regions Group. The Regions Group contains a series of subgroups which control region specific parameters. At the top of the Regions Group is the Region pulldown list. This pulldown contains a list of all Regions. When a particular Region is selected in the Regions pulldown list the parameters which appear elsewhere in the Regions group are those that apply to the selected Region. The Regions Group subgroups consist of the following elements:
Excavate Surfaces subgroup. This subgroup contains parameters for the excavate surfaces (as described above). The Top Surface Slope field allows the user to input the slope of the Excavate Surfaces. Note that Excavate Surfaces are typically oriented with a downhill slope and this requires a negative slope. The Excavate Slopes can either be parallel, i.e. same slope for all excavate surface or they can pivot from a maximum slope for the initial excavation to a slope of zero at the Bridge Surface. This behaviour is controlled by the Keep Constant checkbox. If this checkbox is selected parallel Excavate Surfaces of constant slopes are used, if the checkbox is not selected Excavate Surface slope varies for each excavation lift. The following figures illustrate these options:
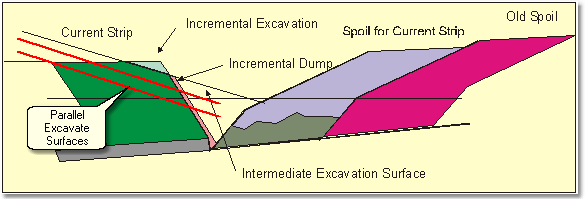
Excavate Surfaces – Constant Slope Option.
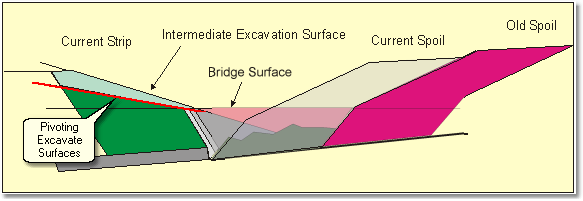
Excavate Surfaces – Slope Pivot Option.
Once the excavation reaches the level of the Bridge Surface there are two options for establishing excavation geometry below the Bridge. If the Apply Below Bridge checkbox is selected the specified Excavate Surface Slope will be applied below the bridge level. If the Apply Below Bridge checkbox is not selected excavate surfaces below the bridge will be horizontal.
Dump Surfaces Subgroup. The Dump Services Subgroup is very similar to the Excavate Surfaces Subgroup. The desired slope for the Dump Surface is specified in the Top Surface Slope field. As Dump Surfaces are normally given and uphill slope relative to the direction of push this number is normally positive. If the Keep Constant check box is selected a series of parallel surfaces with slope equal to the specified Top Surfaces Slope will be produced. If the Keep Constant check box is not selected the Dump Surface slope will pivot from the intersection point with the Bridge and progress with each subsequent lift with the final slope being equal to the specified Top Surface Slope.
Direction of Push Subgroup. The Direction of Push Subgroup specifies the push direction for the selected Region. This push direction determines the advancing dump direction when excavated material is dumped within the region. This parameter can be directly specified by inputting direction into the Direction of Push field, however it is more typically specified by using the Set button. When the Set button is selected the Terrain Cursor becomes active in the Terrain Window allows in the use it to specify the direction via point and click.
Dozer Bridge Surface Subgroup. The Dozer Bridge Surface subgroup allows the Bridge surface to be specified. The Bridge surface can be either horizontal or an inclined plane. The Reference Point is specified by three parameters; Plane Z Level, Easting and Northing. If the Bridge is to be horizontal Easting and Northing do not need to be modified and only the Plane Z Level needs to be input. If the Bridge Surface is to have a slope the slope is specified in the Bridge Surface Slope field. When a slope is specified (i.e. Bridge Surface Slope is not zero) the reference point location must be specified. This is normally achieved by clicking the Set Reference Point button. When this button is selected the Terrain Cursor becomes active in the Terrain Window and this is placed at the known reference point and the point is selected via a left click. The Easting and Northing of the cursor location are then recorded in the Easting and Northing fields. The Bridge Surface will have the specified Z level at the specified Easting and Northing location.
Copy to All Regions Subgroup. Frequently the Excavate Surfaces, Dump Surfaces and Direction of Push parameters will apply to all regions in the simulation. To speed up the design process the Copy to All Regions subgroup allows all these parameters to be copied to all Regions from a single nominated Region. One region is set up with the appropriate parameters and then selected in the Copy From Region pulldown list. The Copy to All Regions button is then clicked and all parameters (except Bridge Surface parameters) are copy to all regions. Bridge Surface parameters are frequently specific for each region and must be entered manually.
The Dump Parameters Page displays the standard Dump Parameters described in the Setting Up a Dump Template topic. Generally the default parameters will be adequate for Dozer Simulation. It is best if the Discreet Dump Volume is not set too high 200 BCM is generally a suitable setting.
The Display Options Page contains settings which control the display of the Dozer Simulation elements.
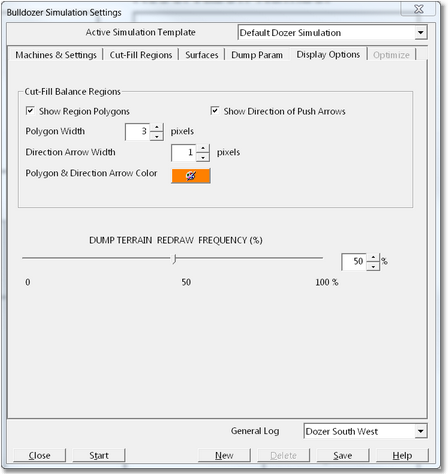
Dozer Simulation Dialog – Display Options Page.
The Display Options page consists of the following elements:
Cut Fill Balance Regions Group. This group contains settings which control the display of the Regions and Push Direction arrows for each region. The display of these elements can be switched on or off and the line weight and colour can be modified.
Dump Terrain Redraw Frequency Slider. After the excavation of each lift the excavated material is progressively dumped. The Terrain is constantly refreshed to reflect this progressive dumping. The frequency of refresh (detail with which the dumping process is displayed) is controlled by the Dump Terrain Redraw Frequency parameter. The higher this parameter is set the more frequently the terrain is refreshed and the more detail of the progressive dumping is revealed. However this frequent refreshing can significantly increase simulation times. The default setting is 50% and this works adequately for most purposes.
The Optimize Page contains settings that control the optimisation process. Note that in order for this page to be accessible the Simulate/Optimize group on the Machines & Settings page must be set to Optimize Parameters.
The following parameters can be selected for optimisation:
•Excavate Surface Slope
•Dump Surface Slope
•Bridge Surface Slope
•Bridge Surface Reference Height
Any of these parameters can be selected individually, hence all parameters can be optimised, any one can be optimised individually or any subset can be optimised.
Furthermore the one parameter can be optimised over all regions (a single value is applied to all regions) or the parameter can be optimised for each region individually (an optimum value determined for each individual region). When the parameter is optimised over all regions it is assumed that a single parameter will be applied for all regions. When the parameter is optimised for individual regions the best value for each individual region is determined. Note that optimising for individual regions can be extremely compute intensive, see section below for recommended procedures for optimisation.
Optimisation is conducted by selecting Optimise in the Simulate/Optimise group on the Machines & Settings page and then inputting the appropriate settings on the Optimise page:
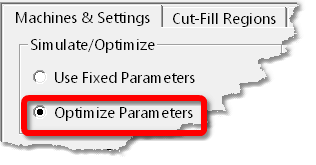
Simulate/Optimise group – Optimise Selected.
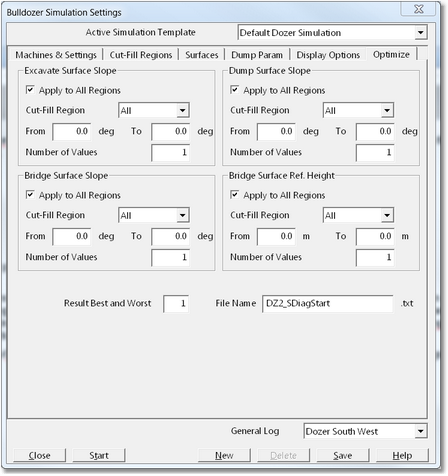
Bulldozer Simulation Settings – Optimize Page.
The Optimize page contains the following elements:
Excavate Surface Slope Group. The Excavate Surface Slope group contains settings that control the optimisation of the Excavate Surface. It contains the following elements:
Apply to All Regions checkbox. When this checkbox is selected the optimisation will be applied to all Regions using the parameters in this group. When the Apply to All Regions checkbox is not selected the Cut – Fill Region pulldown list becomes enabled allowing individual regions to be selected. When a particular region is selected in this pulldown the remaining parameters in the group are applied to the optimisation for this particular region. Each Region can be selected in turn and have its own parameters applied.
From and To fields. These fields allow input of the lower bound and upper bound for the Excavate Surface Slope search range. Only slopes within this range will be investigated for optimisation.
Number of Values field. This determines the number of slope values that will be investigated. The range specified in the From and To fields is evenly divided using the Number of Values parameter to establish the individual slopes that will be investigated in the optimisation process.
Dump Surface Slope Group. The Dump Surface Slope Group is identical to the Excavate Surface Slope Group and all the elements perform the same function to control the optimisation of the Dump Surface Slope.
Bridge Surface Slope Group. This group contains elements that control the optimisation of the Bridge Surface Slope. The Bridge Surface Slope Group has the same form as the Excavate Surface Slope Group and all the elements perform similar functions to control the optimisation of the Bridge Surface Slope.
Bridge Surface Reference Height Group. This group contains elements that control the optimisation of the Bridge Height. The Bridge Surface Reference Height Group has the same form as the Excavate Surface Slope Group and the elements perform similar functions.
Reporting Group. The Reporting Group controls a Report file (text file which is produced for the optimisation. It contains the following elements:
Result Best and Worst field. The report file contains a productivity summary for a range of the parameter values investigated. The Result Best and Worst field controls how many sample values reported in the file. This field defaults to 1, this results in a report entry for the best option and the worst option. If this field is set to 2 the best and second best option and the worst and second worst option are reported.
File Name field. This field allows input of the name of the report text file which are saved.
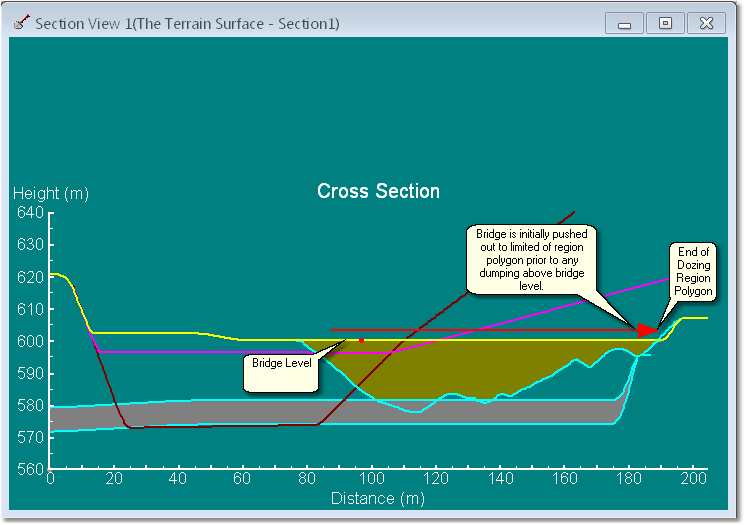
Dozing Sequence - Bridge Building.
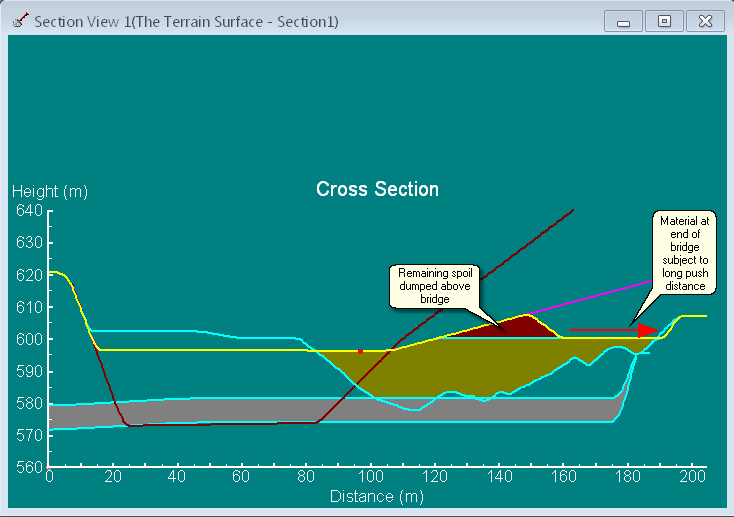
Dozing Sequence - Stacking Above Bridge.
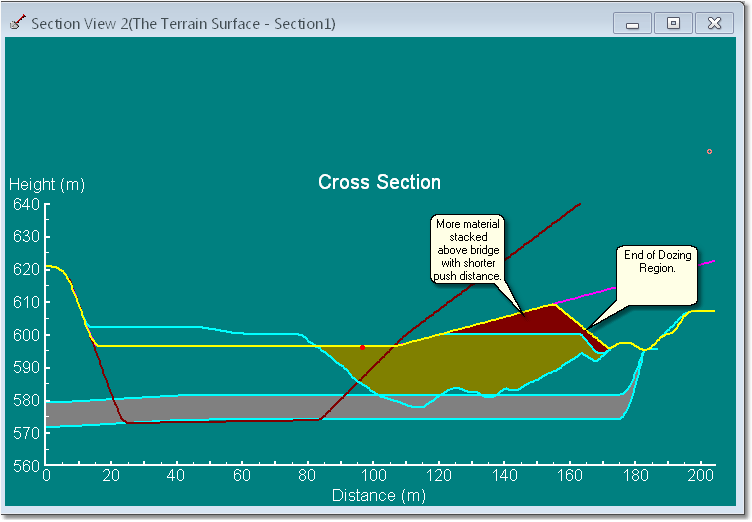
Dozing Sequence - Short Region Option.
A demonstration of the process for setting up a Bulldozer Simulation can be seen in the Cross – Pit Push Bulldozer tutorial.